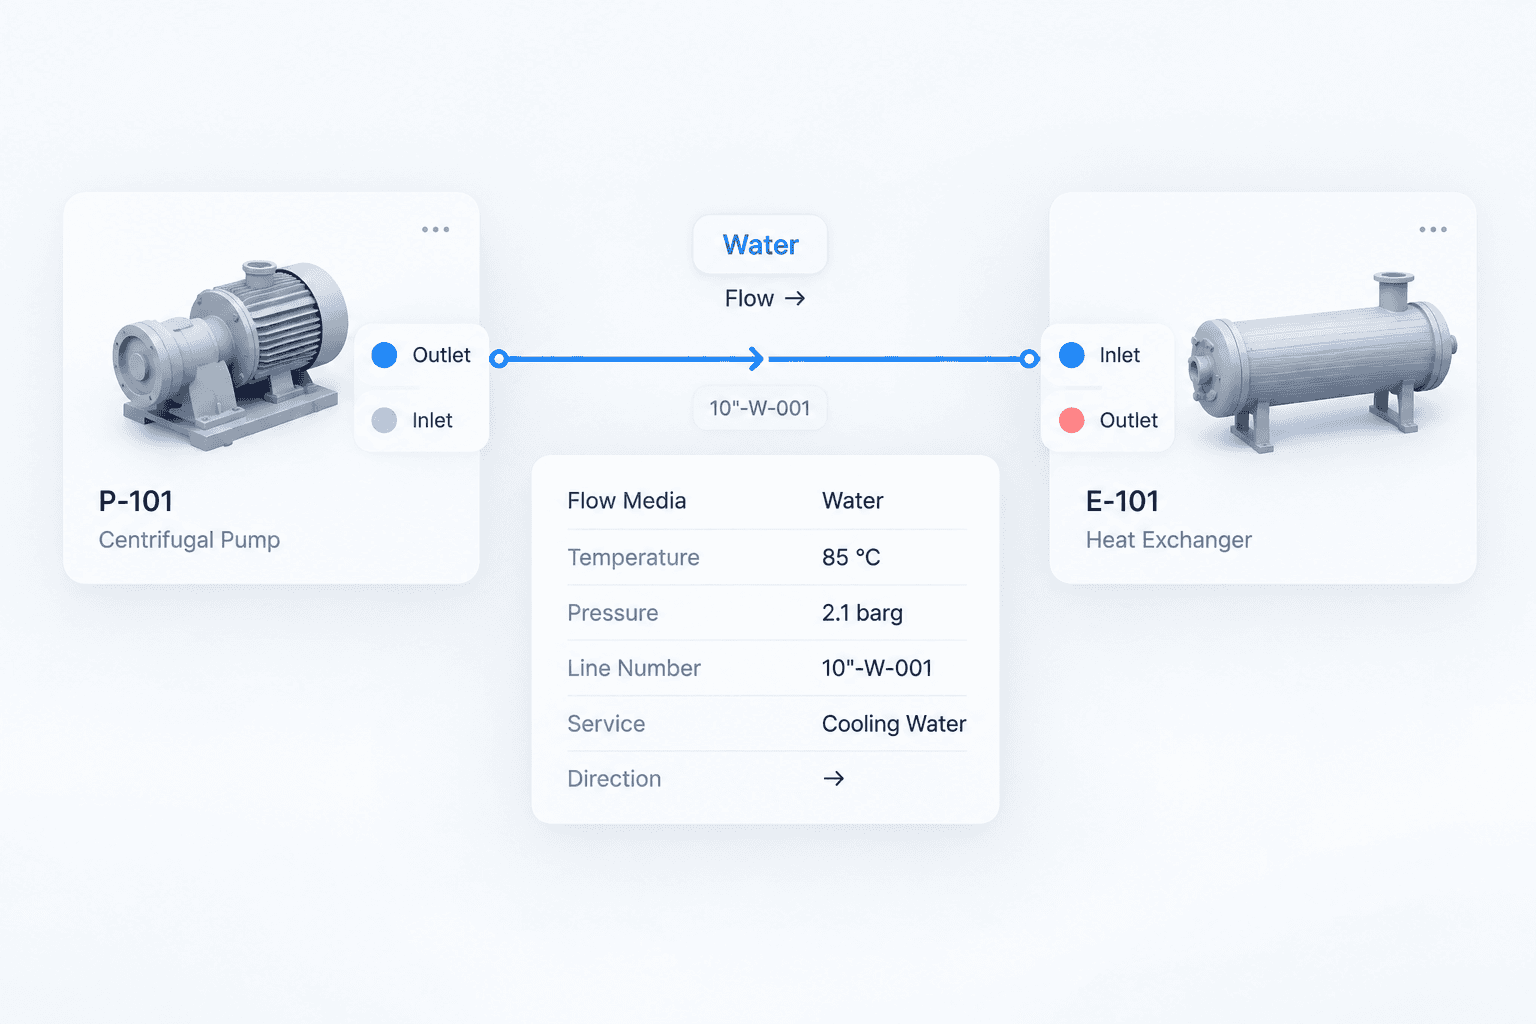
Industrial Ontology Canvas

An ontology-driven industrial AI workspace that connects plant models, engineering relationships, operational data, and AI workflows in one shared system context. It enables engineers to move from fragmented drawings, sensor signals, and technical documents to visual modeling, real-time analysis, and context-aware AI assistance in one environment.

Business model

B2B Enterprise

Role:

Product Engineer

Date:

2026

Industry:

Industrial Operations

The Approach

Build the system first, then extend it with context and AI.

I structured equipment, ports, connections, and flow media as a shared system model, then connected operational data and AI workflows on top of that foundation.

Model the System

Represent equipment, ports, connections, and flow media as meaningful engineering relationships.

Connect the Context

Link sensor data, documents, and failure history back to the assets and relationships they describe.

Extend with AI Workflows

Use the shared context as the foundation for AI-assisted analysis and engineering workflows.

Workflow Strategy

Design the workflow around context, not around tools.

I kept asset context persistent, made relationships visible, and structured evidence progressively so engineers could move through complex investigations without losing orientation or traceability.

01

Anchor on the Asset

Keep the selected equipment as the persistent reference point while signals, documents, alerts, and system context change around it.

02

Connect the Evidence

Bring signals, engineering documents, failure modes, and semantic relationships into one traceable investigation flow.ce the hypotheses that remain supported by evidence.

03

Guide the Investigation

Use hierarchy, workflow states, and progressive detail to help engineers understand what matters, what supports it, and where to investigate next.

From workflow strategy to working product.

I translated these principles into Equipment 360 and used the live prototype to test how context, relationships, and evidence work together in a real investigation workflow.

Industrial Ontology Canvas
Nuclear Power PlantReactor Coolant System (RCS)
85%
JD

Equipment 360 Explorer

Unified asset context, engineering evidence and operational data

Design ContextOperational DataReference DocsEnriched ContextMonitorGeometryLive DataSystem View
P&IDVIEW
Ready
RCS-TK-101RCS-PU-102BRCS-HX-101
RCS-PU-102B – Reactor Coolant System (Sheet 3)
Asset Knowledge GraphCONTEXT
Live
PART_OFMODELMONITORED_BYHAS_READINGMANUFACTURED_BYCONNECTED_TOLOCATED_INHAS_FAILURE_MODEDOCUMENTED_BYHAS_REVISIONMITIGATED_BYHAS_WORK_ORDER
RCS-PU-102B
Equipment
RCS
System
CP-300
Model
PT1212B
Pressure Sensor
3.2 barg
Reading
ACME Pumps
Manufacturer
RCS-PU-102A
Related Equipment
Unit 1 / RCS
Location
Bearing Wear
Failure Mode
Inspection Plan
Maintenance
Maintenance Manual
Document
REV B
Revision
WO-10482
Work Order
EquipmentSystem / SensorDocumentFailure
Instrument TrendsSIGNAL
Live
3.2barg
+2.4%
Aug 9Aug 10Aug 11Aug 12Aug 13Aug 14Aug 15
Engineering DocumentsEVIDENCE
Synced
All (12)Drawings (4)Reports (3)Procedures (3)
RCS-PU-102B_General_Arrangement.pdf
Drawing · REV C · 2023-04-12
RCS-PU-102B_Maintenance_Manual.pdf
Manual · REV B · 2022-11-03
RCS_Centrifugal_Pump_Specification.pdf
Specification · REV D · 2023-01-18
Vendor Datasheet – Model CP-300.pdf
Datasheet · REV A · 2021-06-07
EquipmentSELECTED ASSET
In Service
RCS-PU-102B centrifugal pump

RCS-PU-102B

Reactor Coolant Pump B

TypeCentrifugal Pump
ManufacturerACME Pumps
ModelCP-300
Serial No.ACME-77832
LocationUnit 1 / RCS
Commissioned2018-05-14
StatusIn Service
Alerts & ConditionsCONDITION
Monitoring
Active (1)Recent (4)Resolved (12)
Discharge pressure anomaly detectedCritical
PT1212B · 3.2 barg (expected 2.8 – 3.0)
Aug 15, 2024 08:47
Vibration trending highWarning
PIT031B · 4.2 mm/s (↑)
Aug 14, 2024 16:12
3D ModelVIEW
Ready
RCS-PU-102B centrifugal pump
RCS-PU-102B – 3D Model
Data SourcesSOURCE
Connected
PI Historian
Time series data (142 tags)
Connected
CMMS (Maximo)
Work orders & maintenance
Connected
Document Management (EDMS)
Drawings, manuals, procedures
Connected
LIMS / Chemistry
Water chemistry results
Synced
System ContextHIERARCHY
Ready
Nuclear Power Plant
Reactor Coolant System (RCS)
RCS-PU-102A
Pump A
RCS-PU-102B
Pump B
RCS-HX-101
Heat Exchanger
Ready to run
All nodes connected

Node Anatomy

Designing a Reusable Interaction Model for Industrial Workflows

Defining a Shared Structure Across Every Node

Each node follows the same interaction pattern, identity, typed ports, parameters, actions, and results, while adapting its content to the task.

This shared structure keeps complex workflows consistent and easier to learn, while leaving room for task-specific controls and outputs.

One Interaction Model, Multiple Industrial Capabilities

I standardized the core node structure so users could learn one interaction pattern and reuse it across very different workflow tasks.

57%

PMS providers to be average or poor.

34%

enhanced business intelligence features

58%

prioritize deeper technology integration

87%

expect a shift third-party APIs soon.

Problem Definition

The Gap Between Engineering Design and Operational Reality

icon

Fragmented Silos

Engineers are forced to toggle between legacy P&IDs, Seeq workbooks, and FMEA spreadsheets to investigate a single alarm.

icon

Cognitive Overload

The "Swivel-Chair" friction causes missed diagnoses during high-pressure scenarios.

Collaborated with the PM in the early stages to define three phases of experience design.

01

Develop the MVP basic front desk management system.

Achieve an initial user adoption rate of 70%

02

Implement room category prediction functionality.

50% more feature use, 30% higher user satisfaction.

03

Enhance system and UI performance for personalized services.

40% better system efficiency, fewer user errors.

Collaborated with the PM in the early stages to define three phases of experience design.

01

Develop the MVP basic front desk management system.

Achieve an initial user adoption rate of 70%

02

Implement room category prediction functionality.

50% more feature use, 30% higher user satisfaction.

03

Enhance system and UI performance for personalized services.

40% better system efficiency, fewer user errors.

Solution

Streamlined Access and Interactive Real-Time Data Display

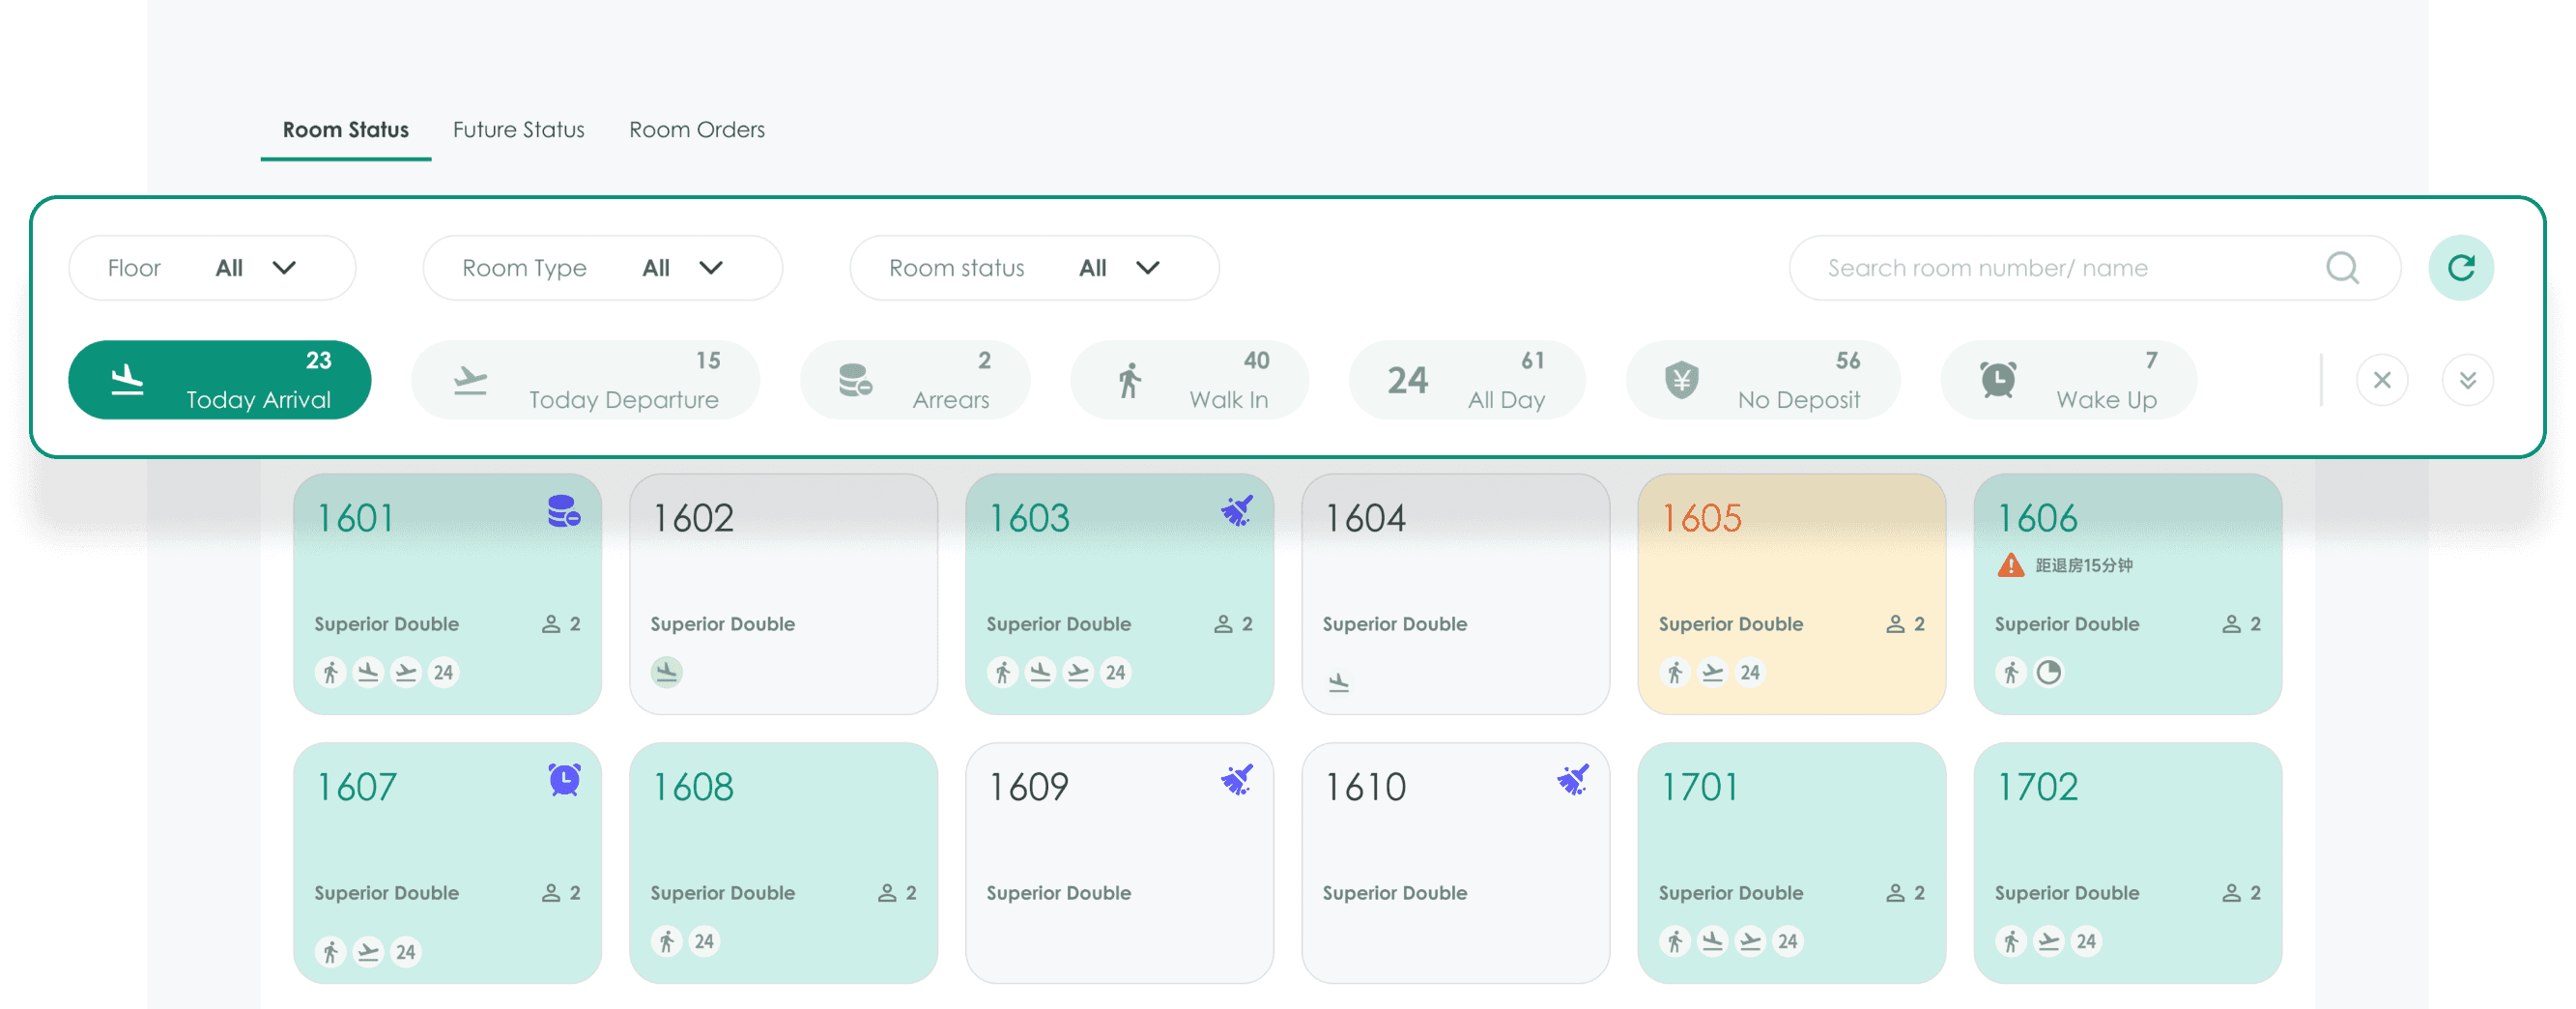
Enhanced Usability and Clarity": Plan B's design prioritizes easy navigation with clear labeling and intuitive layout, simplifying filter adjustments and enhancing overall user-friendliness.

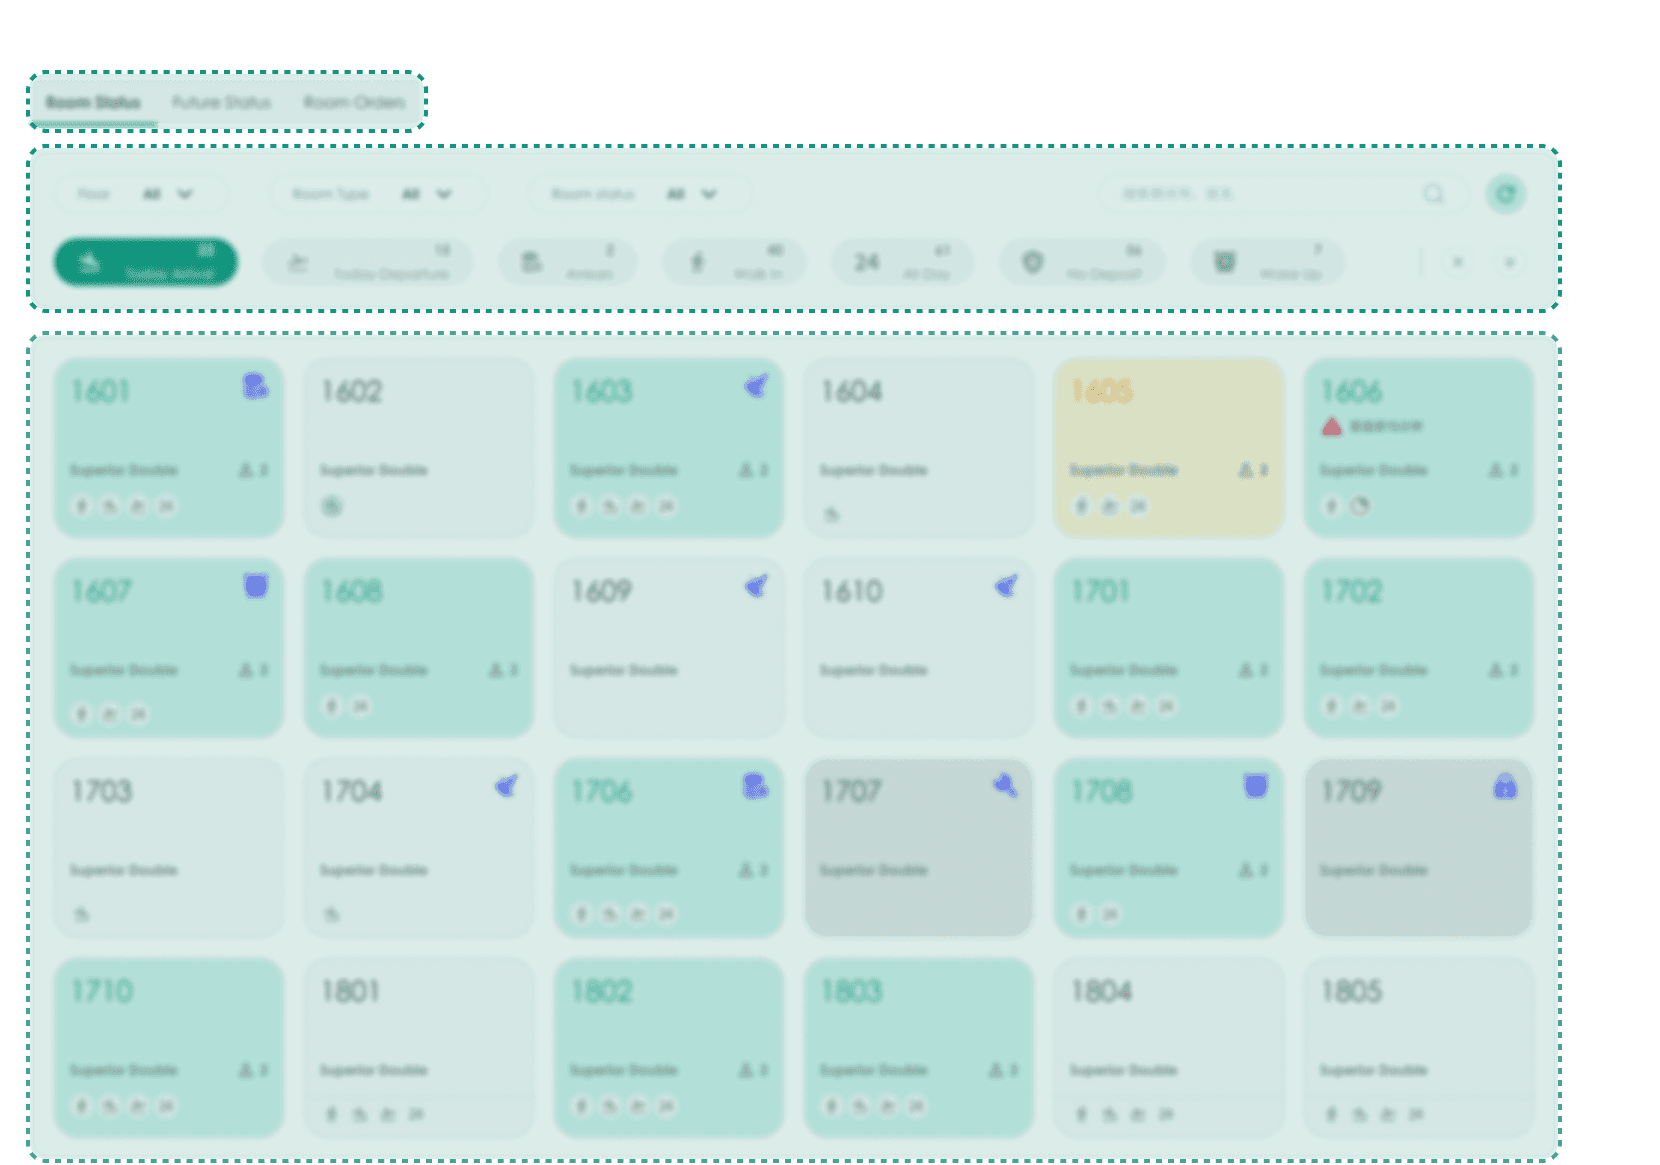
Simplified Layout and Reduced Cognitive Load.

Plan B's simplified layout eases decision-making and minimizes cognitive load, ensuring a smoother and more relaxed user experience.

Streamlining User Choices by Displaying High-Frequency Options.

Compared to Plan A, Plan B does not reduce the number of options but instead only displays a subset of commonly used, high-frequency options, eliminating distractions from other information. This approach facilitates quick decision-making for users by hiding complex or advanced features in deeper-level menus or settings
Let’s create your next big idea.

Let’s create your next big idea.

Let’s create your next big idea.